Quail-Language
Quail Specification
- Quail Specification
Chapter 14: Debugging
14.1 Definitions
Breakpoint is a pair of filename-line number which specifies a location where debugger should pause the program
Debug server is a server that is launched within your Quail main process and which handles breakpoints and other debugger commands
Debug client is a program that is launched separately and which connects to debug server via a socket connection to deliver commands and grab program execution data
14.2 Quail debugger implementation
14.2.1 Connection specification
Debug server and debug client connect via sockets. Debug server should be started first and only then debug client should be launched.
Debug server and debug client exchange messages via sockets. Messages are
strings (not binary) that are separated by \n. E.g. if you want to send
command stop, you should do:
socketBufferedWriter.write("stop\n");
socketBufferedWriter.flush();
Following types of messages are supported (as of 2.0.0-alpha.6):
14.2.1.1 Stop
Syntax: stop
Semantics: forces the program execution to stop
14.2.1.2 Next line
Syntax: next
Semantics: forces the program to resume execution and stop on the next line
14.2.1.3 Continue
Syntax: continue
Semantics: forces the program to resume until it encounters another breakpoint
14.2.1.4 Memory
Syntax: mem
Semantics: requests all contents of memory that are visible in current scope.
Returns messages:
memresult\n- number of memory entries + 1
\n - memory entry encoded in base64.
\n
When you decode it, you will get a string of the following format:variable;value.
Every memory entry is a separate message (which means that it is ended with\n) endmem\n
Example:
Memory contains:
a = 15
b = 14
Request is:
mem
Answer is:
memresult
3
a;15        # but encoded in base64
b;14        # but encoded in base64
endmem
14.2.1.5 Memory
Syntax: eval then code to evaluate encoded in base64 (in 2 separate messages)
Semantics: evaluate given expression in current runtime and scope
Returns messages:
evalresult- unencoded result
Expression is:
a = 14
Request is:
eval
a = 14       # but encoded in base64
Answer is:
evalresult
null         # since a = 14 does not return anything
14.2.2 Debug server behaviour
If connection is lost, debug server fill stop and program execution will continue as usual.
Filenames are interpreted only by Quail debug server, not by client, so relative paths would be relative to QRE.
14.3 Quail debugger usage
14.3.1 Usage of Quail Debug Server
To launch program in debug mode, change launch mode to debug
(See Chapter 12: Console operation)
Default port for debugging will be 4004. To change it add a flag
-G.debugPort=PORT.
After launch, Quail will not start the program until debug client is connected
14.3.2 Usage of QDK Debug Client (CLI)
CLI client could be launched from your QDK with the following command:
java -jar qdk.jar debugClient host port
Where host and port should be substituted with host and port on which the Quail Debug Server runs. To connect to default address on which debug server runs write the following:
java -jar qdk.jar debugClient localhost 4004
When you launch CLI client, you will be asked to write breakpoints for files
in following format: 1 line per file, on each line you specify breakpoints
like this: filename;line1;line2... (e.g. program.q;2;5;6).
After that, when breakpoint is reached, a corresponding message will appear.
Now you can send following commands:
c- continuenl- next linestop- stopmem- memoryeval- eval
Learn more about debug commands in Chapter 14.2.1.
14.3.3 Usage of QDK Debug Client (GUI)
GUI client could be launched from your QDK with the following command:
java -jar qdk.jar debugClientGui
After that, you will be asked to provide address to connect
After entering address you should enter breakpoints in the same format as in CLI client
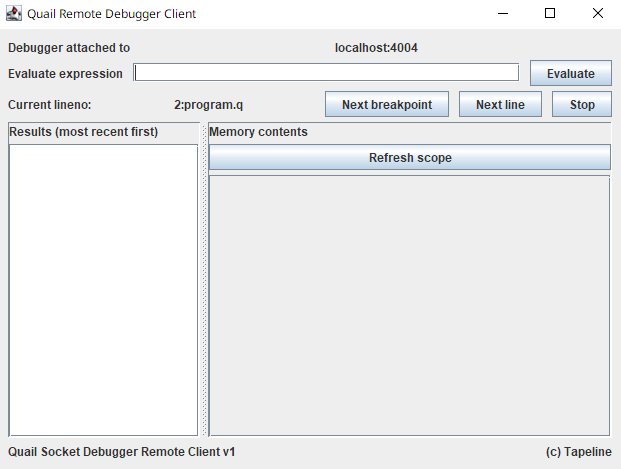
After that you will see a GUI.

In the first row connection information is displayed
In the second row you can enter an expression to evaluate (eval command). The results of evaluation will appear in the list on the left
In the third row you see information about current breakpoint location and can control the flow (commands: continue, next and stop)
On the right there is a table which will display memory contents (mem command)